LispWorks is a Common Lisp implementation that comes with its own Integrated Development Environment (IDE) and its share of unique features, such as the CAPI GUI toolkit. It is proprietary and provides a free limited version.
Here, we will mainly explore its IDE, asking ourselves what it can offer to a seasoned lisper used to Emacs and Slime. The short answer is: more graphical tools, such as an easy to use graphical stepper, a tracer, a code coverage browser or again a class browser. Setting and using breakpoints was easier than on Slime.
LispWorks also provides more integrated tools (the Process browser lists all processes running in the Lisp image and we can stop, break or debug them) and presents many information in the form of graphs (for example, a graph of function calls or a graph of all the created windows).

LispWorks features
We can see a matrix of LispWorks features by edition and platform here: http://www.lispworks.com/products/features.html.
We highlight:
- 32-bit, 64-bit and ARM support on Windows, MacOS, Linux, Solaris, FreeBSD,
- CAPI portable GUI toolkit: provides native look-and-feel on Windows, Cocoa, GTK+ and Motif.
- comes with a graphical “Interface Builder” (think QtCreator) (though not available on MacOS (nor on mobile))
- LispWorks for mobile runtime, for Android and iOS,
- optimized application delivery: LispWorks can use a tree shaker to remove unused lisp code from the delivered applicatiion, thus shipping lighter binaries than existing open-source implementations.
- ability to deliver a dynamic library,
- a Java interface, allowing to call from Lisp to Java or the other way around,
- an Objective-C and Cocoa interface, with drag and drop and multi-touch support,
- a Foreign Language Interface,
- TCP/UDP sockets with SSL & IPv6 support,
- natived threads and symmetric multiprocessing, unicode support, and all other Common Lisp features, and all other LispWorks Enterprise features.
And, of course, a built-in IDE.
LispWorks is used in diverse areas of the industry. They maintain a list of success stories. As for software that we can use ourselves, we find ScoreCloud amazing (a music notation software: you play an instrument, sing or whistle and it writes the music) or OpenMusic (opensource composition environment).
Free edition limitations
The download instructions and the limitations are given on the download page.
The limitations are the following:
- There is a heap size limit which, if exceeded, causes the image to exit. A warning is provided when the limit is approached.
What does it prevent us to do? As an illustration, we can not load this set of libraries together in the same image:
(ql:quickload '("alexandria" "serapeum" "bordeaux-threads"
    "lparallel" "dexador" "hunchentoot" "quri"
    "cl-ppcre" "mito"))
-
There is a time limit of 5 hours for each session, after which LispWorks Personal exits, possibly without saving your work or performing cleanups such as removing temporary files. You are warned after 4 hours of use.
-
It is impossible to build a binary. Indeed, the functions save-image, deliver (the function to create a stand-alone executable), and load-all-patches are not available.
-
Initialization files are not loaded. If you are used to initializing Quicklisp from your
~/.sbclrcon Emacs, you’ll have to load an init file manually every time you start LispWorks ((load #p"~/.your-init-file)).
For the record, the snippet provided by Quicklisp to put in one’s startup file is the following:
;; provided you installed quicklisp in ~/quicklisp/
(let ((quicklisp-init (merge-pathnames "quicklisp/setup.lisp"
                                       (user-homedir-pathname))))
  (when (probe-file quicklisp-init)
    (load quicklisp-init)))
You’ll have to paste it to the listener window (with the C-y key, y as “yank”).
- Layered products that are part of LispWorks Professional and Enterprise Editions (CLIM, KnowledgeWorks, Common SQL and LispWorks ORB) are not included. But we can try the CAPI toolkit.
The installation process requires you to fill an HTML form to receive a download link, then to run a first script that makes you accept the terms and the licence, then to run a second script that installs the software.
Licencing model
LispWorks actually comes in four paid editions. It’s all explained by themselves here: http://www.lispworks.com/products/lispworks.html. In short, there is:
- a Hobbyist edition with
save-imageandload-all-patches, to apply updates of minor versions, without the obvious limitations, for non-commercial and non-academic use, - a HobbyistDV edition with the
deliverfunction to create executables (still for non-commercial and non-academic uses), - a Professional edition, with the
deliverfunction, for commercial and academic uses, - an Enterprise one, with their enterprise modules: the Common SQL interface, LispWorks ORB, KnowledgeWorks.
At the time of writing, the licence of the hobbyist edition costs 750 USD, the pro version the double. They are bought for a LW version, per platform. They have no limit of time.
LispWorks IDE
The LispWorks IDE is self-contained, but it is also possible to use LispWorks-the-implementation from Emacs and Slime (see below). The IDE runs inside the Common Lisp image, unlike Emacs which is an external program that communicates with the Lisp image through Swank and Slime. User code runs in the same process.
The editor
The editor offers what’s expected: a TAB-completion pop-up, syntax
highlighting, Emacs-like keybindings (including the M-x extended
command). The menus help the discovery.
We personally found the editing experience a bit “raw”. For example:
- indention after a new line is not automatic, one has to press TAB again.
- the auto-completion is not fuzzy.
- there are no plugins similar to
Paredit(there is a brand new (2021) Paredit for LispWorks) or Lispy, nor a Vim layer.
We also had an issue, in that the go-to-source function bound to M-.
did not work out for built-in Lisp symbols. Apparently, LispWorks
doesn’t provide much source code, and mostly code of the editor. Some
other commercial Lisps, like Allegro CL, provide more source code
The editor provides an interesting tab: Changed Definitions. It lists the functions and methods that were redefined since, at our choosing: the first edit of the session, the last save, the last compile.
See also:
- the Editor User Guide.
Keybindings
Most of the keybindings are similar to Emacs, but not all. Here are some differences:
- to compile a function, use
C-S-c(control, shift and c), instead of C-c C-c. - to compile the current buffer, use
C-S-b(instead of C-c C-k).
Similar ones include:
C-gto cancel what you’re doing,C-x C-sto save the current buffer,M-wandC-yto copy and paste,M-b,M-f,C-a,C-e… to move around words, to go to the beginning or the end of the line,C-kto kill until the end of the line,C-wto kill a selected region,M-.to find the source of a symbol,C-x C-eto evaluate the current defun,- …
Some useful functions don’t have a keybinding by default, for example:
- clear the REPL with
M-x Clear Listener Backward Kill Line
It is possible to use classical keybindings, à la KDE/Gnome. Go to the Preferences menu, Environment and in the Emulation tab.
There is no Vim layer.
Searching keybindings by name
It is possible to search for a keybinding associated to a function, or
a function name from its keybinding, with the menu (Help -> Editing ->
Key to Command / Command to Key) or with C-h followed by a key,
as in Emacs. For example type C-h k then enter a keybinding to
get the command name. See more with C-h ?.
Tweaking the IDE
It is possible to change keybindings. The editor’s state is accessible
from the editor package, and the editor is built with the CAPI
framework, so we can use the capi interface too. Useful functions
include:
`
editor:bind-key
editor:defcommand
editor:current-point
editor:with-point  ;; save point location
editor:move-point
editor:*buffer-list*
editor:*in-listener* ;; returns T when we are in the REPL
…
Here’s how you can bind keys:
;; Indent new lines.
;; By default, the point is not indented after a Return.
(editor:bind-key "Indent New Line" #\Return :mode "Lisp")

;; Insert pairs.
(editor:bind-key "Insert Parentheses For Selection" #\( :mode "Lisp")
(editor:bind-key "Insert Double Quotes For Selection"
   #\"
  :mode "Lisp")
Here’s how to define a new command. We make the ) key
to go past the next closing parenthesis.
(editor:defcommand "Move Over ()" (p)
  "Move past the next close parenthesis.
Any indentation preceeding the parenthesis is deleted."
  "Move past the next close parenthesis."
  ;; thanks to Thomas Hermann
  ;; https://github.com/ThomasHermann/LispWorks/blob/master/editor.lisp
  (declare (ignore p))
  (let ((point (editor:current-point)))
    (editor:with-point ((m point))
      (cond ((editor::forward-up-list m)
	     (editor:move-point point m)
             (editor::point-before point)
             (loop (editor:with-point ((back point))
                     (editor::back-to-indentation back)
                     (unless (editor:point= back point)
                       (return)))
                   (editor::delete-indentation point))
	     (editor::point-after point))
	    (t (editor:editor-error))))))

(editor:bind-key "Move Over ()" #\) :mode "Lisp")
And here’s how you can change indentation for special forms:
(editor:setup-indent "if" 1 4 1)
See also:
- a list of LispWork keybindings: https://www.nicklevine.org/declarative/lectures/additional/key-binds.html
The listener
The listener is the REPL we are expecting to find, but it has a slight difference from Slime.
It doesn’t evaluate the input line by line or form by form, instead it
parses the input while typing. So we get some errors instantly. For
example, we type (abc. So far so good. Once we type a colon to get
(abc:, an error message is printed just above our input:
Error while reading: Reader cannot find package ABC.

CL-USER 1 > (abc:
Indeed, now abc: references a package, but such a package doesn’t exist.
Its interactive debugger is primarily textual but you can also interact with it with graphical elements. For example, you can use the Abort button of the menu bar, which brings you back to the top level. You can invoke the graphical debugger to see the stacktraces and interact with them. See the Debugger button at the very end of the toolbar.
If you see the name of your function in the stacktraces (you will if you wrote and compiled your code in a file, and not directly wrote it in the REPL), you can double-click on its name to go back to the editor and have it highlight the part of your code that triggered the error.
M-v in Slime.
It is possible to choose the graphical debugger to appear by default, instead of the textual one.
The listener provides some helper commands, not unlike Slime’s ones starting with a comma ,:
CL-USER 1 > :help

:bug-form <subject> &key <filename>
         Print out a bug report form, optionally to a file.
:get <variable> <command identifier>
         Get a previous command (found by its number or a symbol/subform within it) and put it in a variable.
:help    Produce this list.
:his &optional <n1> <n2>
         List the command history, optionally the last n1 or range n1 to n2.
:redo &optional <command identifier>
         Redo a previous command, found by its number or a symbol/subform within it.
:use <new> <old> &optional <command identifier>
         Do variant of a previous command, replacing old symbol/subform with new symbol/subform.
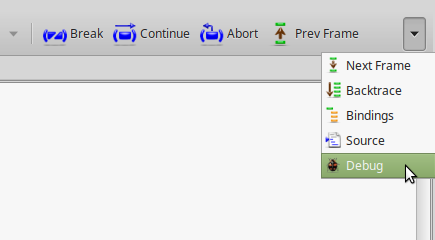
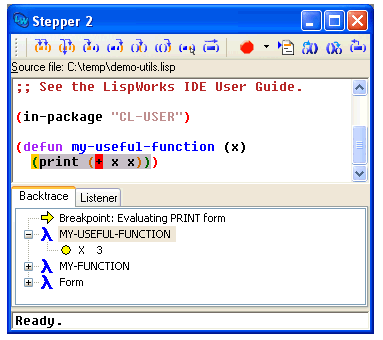
The stepper. Breakpoints.
The stepper is one of the areas where LispWorks shines.
When your are writing code in the editor window, you can set
breakpoints with the big red “Breakpoint” button (or by calling M-x Stepper Breakpoint).
This puts a red mark in your code.
The next time your code is executed, you’ll get a comprehensive Stepper pop-up window showing:
- your source code, with an indicator showing what expression is being evaluated
- a lower pane with two tabs:
- the backtrace, showing the intermediate variables, thus showing their evolution during the execution of the program
- the listener, in the context of this function call, where you can evaluate expressions
- and the menu bar with the stepper controls: you can step into the next expression, step on the next function call, continue execution until the position of the cursor, continue the execution until the next breakpoint, etc.
That’s not all. The non-visual, REPL-oriented stepper is also nice. It shows the forms that are being evaluated and their results.
In this example, we use :s to “step” though the current form and its subforms. We are using the usual listener, we can write any Lisp code after the prompt (the little ` -> ` here), and we have access to the local variables (X).
CL-USER 4 > (defun my-abs (x)
              (cond ((> x 0) x) ((< x 0) (- x)) (t 0)))
CL-USER 5 > (step (my-abs -5))
(MY-ABS -5) -> :s
   -5 -> :s
   -5
   (COND ((> X 0) X) ((< X 0) (- X)) (T 0)) <=> (IF (> X 0) (PROGN X) (IF (< X 0) (- X) (PROGN 0)))
   ;; Access to the local variables:
   (IF (> X 0) (PROGN X) (IF (< X 0) (- X) (PROGN 0))) -> (format t "Is X equal to -5? ~a~&" (if (equal x -5) "yes" "no"))
Is X equal to -5? yes
   (IF (> X 0) (PROGN X) (IF (< X 0) (- X) (PROGN 0))) -> :s
      (> X 0) -> :s
         X -> :s
         -5
         0 -> :s
         0
      NIL
      (IF (< X 0) (- X) (PROGN 0)) -> :s
         (< X 0) -> :s
            X -> :s
            -5
            0 -> :s
            0
         T
         (- X) -> :s
            X -> :s
            -5
         5
      5
   5
5
Here are the available stepper commands (see :?):
:s       Step this form and all of its subforms (optional +ve integer arg)
:st      Step this form without stepping its subforms
:si      Step this form without stepping its arguments if it is a function call
:su      Step up out of this form without stepping its subforms
:sr      Return a value to use for this form
:sq      Quit from the current stepper level
:bug-form <subject> &key <filename>
         Print out a bug report form, optionally to a file.
:get <variable> <command identifier>
         Get a previous command (found by its number or a symbol/subform within it) and put it in a variable.
:help    Produce this list.
:his &optional <n1> <n2>
         List the command history, optionally the last n1 or range n1 to n2.
:redo &optional <command identifier>
         Redo a previous command, found by its number or a symbol/subform within it.
:use <new> <old> &optional <command identifier>
         Do variant of a previous command, replacing old symbol/subform with new symbol/subform.
The class browser
The class browser allows us to examine a class’s slots, parent classes, available methods, and some more.
Let’s create a simple class:
(defclass person ()
  ((name :accessor name
         :initarg :name
         :initform "")
   (lisper :accessor lisperp
           :initform t)))
Now call the class browser:
- use the “Class” button from the listener,
- or use the menu Expression -> Class,
- or put the cursor on the class and call
M-x Describe class.
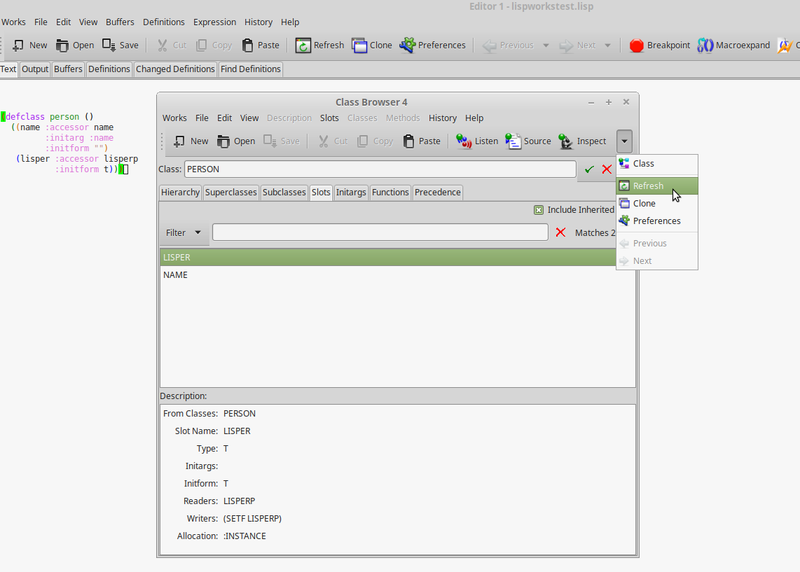
It is composed of several panes:
- the class hierarchy, showing the superclasses on the left and the subclasses on the right, with their description to the bottom,
- the superclasses viewer, in the form of a simple schema, and the same for subclasses,
- the slots pane (the default),
- the available initargs,
- the existing generic functions for that class
- and the class precedence list.
The Functions pane lists all methods applicable to that class, so we can discover public methods provided by the CLOS object system: initialize-instance, print-object, shared-initialize, etc. We can double-click on them to go to their source. We can choose not to include the inherited methods too (see the “include inherited” checkbox).
You’ll find buttons on the toolbar (for example, Inspect a generic function) and more actions on the Methods menu, such as a way to see the functions calls, a menu to undefine or trace a function.
See more:
The function call browser
The function call browser allows us to see a graph of the callers and the callees of a function. It provides several ways to filter the displayed information and to further inspect the call stack.
slime-who-[calls, references, binds, sets, depends-on, specializes, macroexpands].
After loading a couple packages, here’s a simple example showing who calls the string-trim function.
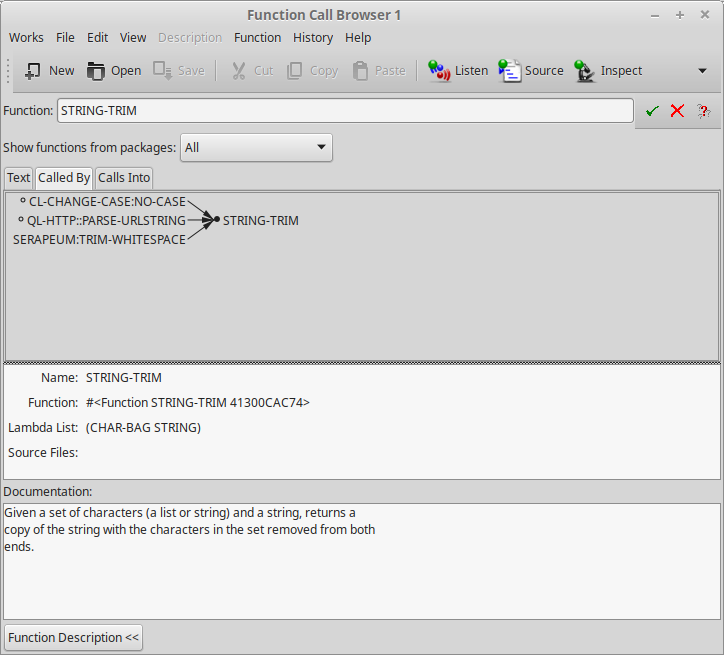
It shows functions from all packages, but there is a select box to restrict it further, for example to the “current and used” or only to the current packages.
Double click on a function shown in the graph to go to its source. Again, as in many LispWorks views, the Function menu allows to further manipulate selected functions: trace, undefine, listen (paste the object to the Listener)…
The Text tab shows the same information, but textually, the callers and callees side by side.
We can see cross references for compiled code, and we must ensure the feature is on. When we compile code, LispWorks shows a compilation output likes this:
;;; Safety = 3, Speed = 1, Space = 1, Float = 1, Interruptible = 1
;;; Compilation speed = 1, Debug = 2, Fixnum safety = 3
;;; Source level debugging is on
;;; Source file recording is  on
;;; Cross referencing is on
We see that cross referencing is on. Otherwise, activate it with (toggle-source-debugging t).
See more:
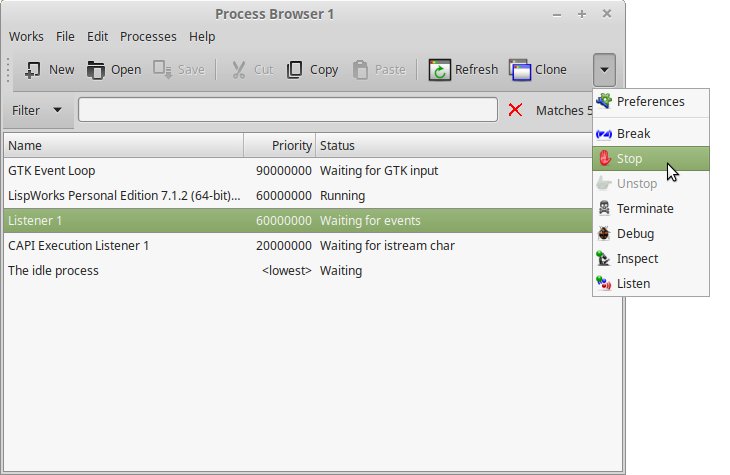
The Process Browser
The Process Browser shows us a list of all threads running. The input area allows to filter by name. It accepts regular expressions. Then we can stop, inspect, listen, break into these processes.
See more:
Saving images
Saving images with LispWorks is different than with SBCL:
- we can save an image now, or schedule snapshots later in time
- the new created image becomes the default core image for our LispWorks environment
- the REPL session is saved
- the windows configuration is saved
- threads are saved
So, effectively, we can save an image and have our development environment back to the same state, effectively allowing to take snapshots of our current work and to continue where we left of.
For example, we can start a game from the REPL, play a little bit in its window, save an image, and when restored we will get the game and its state back.
Misc
We like the Search Files functionality. It is like a recursive
grep, but we get a typical LispWorks graphical window
that displays the results, allows to double-click on them and that offers
some more actions.
Last but not least, have a look at the compilation conditions browser. LispWorks puts all warnings and errors into a special browser when we compile a system. From now on we can work on fixing them and see them disappear from the browser. That helps keeping track of warnings and errors during development.
Using LispWorks from Emacs and Slime
To do that, you have two possibilities. The first one is to start LispWorks normally, start a Swank server and connect to it from Emacs (Swank is the backend part of Slime).
First, let’s load the dependencies:
(ql:quickload "swank")
;; or
(load "~/.emacs.d/elpa/slime-20xx/swank-loader.lisp")
Start a server:
(swank:create-server :port 9876)
;; Swank started at port: 9876.
9876
From Emacs, run M-x slime-connect, choose localhost and 9876 for the port.
You should be connected. Check with: (lisp-implementation-type). You are now able to use LispWorks’ features:
(setq button
      (make-instance 'capi:push-button
                     :data "Button"))
(capi:contain button)
The second possibility is to create a non-GUI LispWorks image, with
Swank loaded, and to run this image from SLIME or SLY. For example, to
create a so-called console image with multiprocessing enabled:
(in-package "CL-USER")
(load-all-patches)
(save-image "~/lw-console"
            :console t
            :multiprocessing t
            :environment nil)
and run LispWorks like this to create the new image ~/lw-console:
lispworks-7-0-0-x86-linux -build /tmp/resave.lisp
However: console is implemented only for Windows and Mac.
See LispWorks’ documentation.
Delivering applications
LispWorks’ delivery method revolves around its delivery function. It has good documentation: https://www.lispworks.com/documentation/lw80/deliv/deliv.htm.
Unlike other open-source Lisps, LispWorks provides a tree-shaker that can strip-off packages from the delivered application, allowing to build small binaries, around 7MB.
Delivery limitations
LispWorks’s delivery doesn’t include compile-file into the delivered
application (nor save-image, deliver and the IDE). As such, it isn’t possible to change code on the fly on a
delivered image. No Swank server, no possibility to use
ql:quickload.
To allow remote debugging, LW however provides its own debugger client. On the backend, do:
(require "remote-debugger-client")
(dbg:start-client-remote-debugging-server :announce t)
and on the IDE, do:
(require "remote-debugger-full")
(dbg:ide-connect-remote-debugging "host" :open-a-listener t)
See also
- LispWorks IDE User Guide (check out the sections we didn’t cover)
- LispWorks on Wikipedia
- the Awesome LispWorks list
- Real Image-based approach in Common Lisp - differences between SBCL and LispWorks.
- blog post: Delivering a LispWorks application
- lw-plugins - LispWorks plugins:
- terminal integration, code folding, side tree, markdown highlighting, Nerd Fonts, fuzzy-matching, enhanced directory mode, expand region, pair editing, SVG rendering…
Page source: lispworks.md