You entered this new world of Lisp and now wonder: how can we debug what’s going on? How is it more interactive than other platforms? What does the interactive debugger bring, apart from stack traces?
Print debugging
Well of course we can use the famous technique of “print debugging”. Let’s just recap a few print functions.
print works, it prints a readable representation of its argument,
which means what is printed can be read back in by the Lisp
reader. It accepts only one argument.
princ focuses on an aesthetic representation.
(format t "~a" …), with the aesthetic directive, prints a string (in t, the standard output
stream) and returns nil, whereas format nil … doesn’t print anything
and returns a string. With many format controls we can print several
variables at once.
print has this useful debugging feature that it prints and returns
the result form it was given as argument. You can intersperse print
statements in the middle of your algorithm, it won’t break it.
(+ 2 (print 40))
Logging
Logging is already a good evolution from print debugging ;)
log4cl is the popular, de-facto logging library although it isn’t the only one. Download it:
(ql:quickload "log4cl")
and let’s have a dummy variable:
(defvar *foo* '(:a :b :c))
We can use log4cl with its log nickname, then it is as simple to use as:
(log:info *foo*)
;; <INFO> [13:36:49] cl-user () - *FOO*: (:A :B :C)
We can interleave strings and expressions, with or without format
control strings:
(log:info "foo is " *foo*)
;; <INFO> [13:37:22] cl-user () - foo is *FOO*: (:A :B :C)
(log:info "foo is ~{~a~}" *foo*)
;; <INFO> [13:39:05] cl-user () - foo is ABC
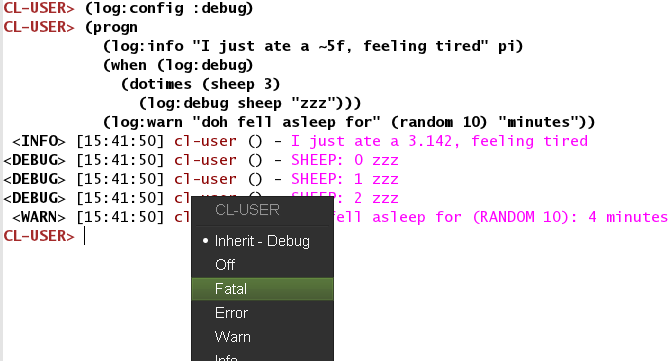
With its companion library log4slime, we can interactively change
the log level:
- globally
- per package
- per function
- and by CLOS methods and CLOS hierarchy (before and after methods)
It is very handy, when we have a lot of output, to turn off the logging of functions or packages we know to work, and thus narrowing our search to the right area. We can even save this configuration and re-use it in another image, be it on another machine.
We can do all this through commands, keyboard shortcuts and also through a menu or mouse clicks.
We invite you to read log4cl’s README.
Using the powerful REPL
Part of the joy of Lisp is the excellent REPL. Its existence usually delays the need to use other debugging tools, if it doesn’t annihilate them for the usual routine.
As soon as we define a function, we can try it in the REPL. In Slime,
compile a function with C-c C-c (the whole buffer with C-c C-k),
switch to the REPL with C-c C-z and try it. Eventually enter the
package you are working on with (in-package :your-package)
or C-c ~ (slime-sync-package-and-default-directory,
which will also change the default working directory to the package definition’s directory).
The feedback is immediate. There is no need to recompile everything, nor to restart any process, nor to create a main function and define command line arguments for use in the shell (which we can of course do later on when needed).
We usually need to create some data to test our function(s). This is a
subsequent art of the REPL existence and it may be a new discipline
for newcomers. A trick is to write the test data alongside your
functions but below a #+nil feature test (or safer, +(or): it is still possible that someone pushed NIL to the *features* list) so that only you can
manually compile them:
#+nil
(progn
   (defvar *test-data* nil)
   (setf *test-data* (make-instance 'foo …)))
When you load this file, *test-data* won’t exist, but you can
manually create it with C-c C-c.
We can define tests functions like this.
Some do similarly inside #| … |# comments.
All that being said, keep in mind to write unit tests when time comes ;)
Inspect and describe
These two commands share the same goal, printing a description of an
object, inspect being the interactive one.
(inspect *foo*)

The object is a proper list of length 3.
0. 0: :A
1. 1: :B

2. 2: :C
> q
We can also, in editors that support it, right-click on any object in
the REPL and inspect them (or C-c I on the object to inspect in Slime).
We are presented a screen where we can
dive deep inside the data structure and even change it.
Let’s have a quick look with a more interesting structure, an object:
(defclass foo ()
    ((a :accessor foo-a :initform '(:a :b :c))
     (b :accessor foo-b :initform :b)))
;; #<STANDARD-CLASS FOO>
(make-instance 'foo)
;; #<FOO {100F2B6183}>
We right-click on the #<FOO object and choose “inspect”. We are
presented an interactive pane (in Slime):
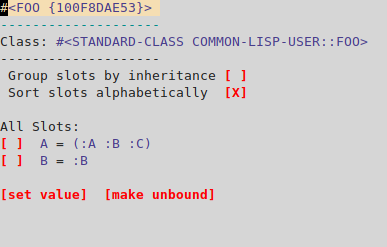
When we click or press enter on the line of slot A, we inspect it further:
#<CONS {100F5E2A07}>
--------------------
A proper list:
0: :A
1: :B
2: :C
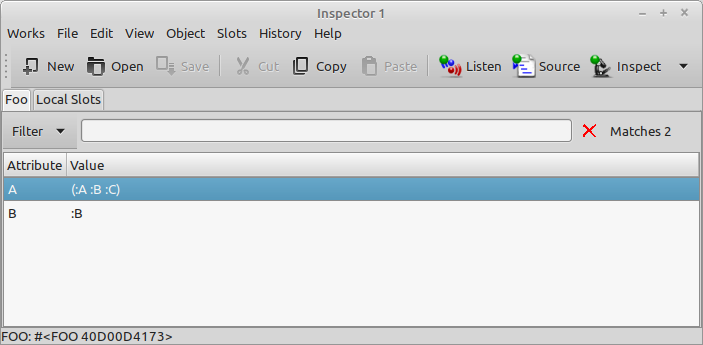
In LispWorks, we can use a graphical inspector:
Trace
trace allows us to see when a function was called, what arguments it received, and the value it returned.
(defun factorial (n)
  (if (plusp n)
    (* n (factorial (1- n)))
    1))
To start tracing a function, just call trace with the function name
(or several function names):
(trace factorial)

(factorial 2)
  0: (FACTORIAL 3)
    1: (FACTORIAL 2)
      2: (FACTORIAL 1)
        3: (FACTORIAL 0)
        3: FACTORIAL returned 1
      2: FACTORIAL returned 1
    1: FACTORIAL returned 2
  0: FACTORIAL returned 6
6

(untrace factorial)
To untrace all functions, just evaluate (untrace).
To get a list of currently traced functions, evaluate (trace) with no arguments.
In Slime we have the shortcut C-c M-t to trace or untrace a
function.
If you don’t see recursive calls, that may be because of the compiler’s optimizations. Try this before defining the function to be traced:
(declaim (optimize (debug 3))) ;; or C-u C-c C-c to compile with maximal debug settings.
The output is printed to *trace-output* (see the CLHS).
Trace options
trace accepts options. For example, you can use :break t to invoke
the debugger at the start of the function, before it is called (more on break below):
(trace factorial :break t)
(factorial 2)
We can define many things in one call to trace. For instance,
options that appear before the first function name to trace are
global, they affect all traced functions that we add afterwards. Here,
:break t is set for every function that follows: factorial, foo
and bar:
(trace :break t factorial foo bar)
On the contrary, if an option comes after a function name, it acts as
a local option, only for its preceding function. That’s how we first
did. Below foo and bar come after, they are not affected by :break:
(trace factorial :break t foo bar)
But do you actually want to break before the function call or just
after it? With :break as with many options, you can choose. These
are the options for :break:
:break form  ;; before
:break-after form
:break-all form ;; before and after
form can be any form that evaluates to true.
Note that we explained the trace function of SBCL. Other
implementations may have the same feature with another syntax and
other option names. For example, in LispWorks it is “:break-on-exit”
instead of “:break-after”, and we write (trace (factorial :break t)).
Below are some other options but first, a trick with :break.
Trace options: break
The argument to an option can be any form. Here’s a trick, on SBCL, to
get the break window when we are about to call factorial
with 0. (sb-debug:arg 0) refers to n, the first argument.
CL-USER> (trace factorial :break (equal 0 (sb-debug:arg 0)))
;; WARNING: FACTORIAL is already TRACE'd, untracing it first.
;; (FACTORIAL)
Running it again:
CL-USER> (factorial 3)
  0: (FACTORIAL 3)
    1: (FACTORIAL 2)
      2: (FACTORIAL 1)
        3: (FACTORIAL 0)

breaking before traced call to FACTORIAL:
   [Condition of type SIMPLE-CONDITION]

Restarts:
 0: [CONTINUE] Return from BREAK.
 1: [RETRY] Retry SLIME REPL evaluation request.
 2: [*ABORT] Return to SLIME's top level.
 3: [ABORT] abort thread (#<THREAD "repl-thread" RUNNING {1003551BC3}>)

Backtrace:
  0: (FACTORIAL 1)
      Locals:
        N = 1   <---------- before calling (factorial 0), n equals 1.
Trace options: trace on conditions, trace if called from another function
:condition enables tracing only if the condition in form evaluates to true.
:condition form
:condition-after form
:condition-all form
If :condition is specified, then trace does nothing unless Form evaluates to true at the time of the call. :condition-after is similar, but suppresses the initial printout, and is tested when the function returns. :condition-all tries both before and after.
:wherein can be super useful:
:wherein Names
If specified, Names is a function name or list of names. trace does nothing unless a call to one of those functions encloses the call to this function (i.e. it would appear in a backtrace.) Anonymous functions have string names like “DEFUN FOO”.
:report Report-Type
If Report-Type is trace (the default) then information is reported by printing immediately. If Report-Type is nil, then the only effect of the trace is to execute other options (e.g. print or break). Otherwise, Report-Type is treated as a function designator and, for each trace event, funcalled with 5 arguments: trace depth (a non-negative integer), a function name or a function object, a keyword (:enter, :exit or :non-local-exit), a stack frame, and a list of values (arguments or return values).
See also :print to enrich the trace output.
It is expected that implementations extend trace with non-standard
options. And we didn’t list all available options, so please refer to
your implementation’s documentation:
Tracing method invocation
In SBCL, we can use (trace foo :methods t) to trace the execution order of method combination (before, after, around methods). For example:
(trace foo :methods t)

(foo 2.0d0)
  0: (FOO 2.0d0)
    1: ((SB-PCL::COMBINED-METHOD FOO) 2.0d0)
      2: ((METHOD FOO (FLOAT)) 2.0d0)
        3: ((METHOD FOO (T)) 2.0d0)
        3: (METHOD FOO (T)) returned 3
      2: (METHOD FOO (FLOAT)) returned 9
      2: ((METHOD FOO :AFTER (DOUBLE-FLOAT)) 2.0d0)
      2: (METHOD FOO :AFTER (DOUBLE-FLOAT)) returned DOUBLE
    1: (SB-PCL::COMBINED-METHOD FOO) returned 9
  0: FOO returned 9
9
It is also possible in CCL.
See the CLOS section for a tad more information.
Interactive Trace Dialog
Both SLIME and SLY provide an interactive view for traces that features better visualization of traces, and also access to the arguments and return values in their real form, via inspectors, not just the printed representation.

How it works: (the following instructions are for SLIME)
- Select the functions to trace using
M-x slime-trace-dialog-toggle-tracebound toC-c M-t. - Evaluate code that calls the traced functions.
- Open the trace dialog tool via
M-x slime-trace-dialogbound toC-c T. - The list of traced functions appear under
Traced specs. Traces are fetched in batches. So use the the[refresh]button to update status information about tracing (number of available traces that can be fetched). - Then use either the
[fetch next batch]or[fetch all]buttons to fetch the traces. Traces appear underTraced specsafter that, and you can use the SLIME inspector to visualize their data (arguments and return values). - After more code that calls the traced functions is evaluated, repeat the process (go to step 4).
But, that flow can get a bit tedious, because of the separation between updating the status of the traces and fetching them. Sometimes it is better to just fetch the traces without updating the status first. We can do that invoking the command M-x slime-trace-dialog-fetch-traces bound to G. So, instead of steps 4 and 5, just press G to update the user interface.
These are some of the Emacs commands bound to useful keys:
g
M-x slime-trace-dialog-fetch-status
Update information on the trace collection and traced specs.
G
M-x slime-trace-dialog-fetch-traces
Fetch the next batch of outstanding (not fetched yet) traces. With a C-u prefix argument, repeat until no more outstanding traces.
C-k
M-x slime-trace-dialog-clear-fetched-traces
Prompt for confirmation, then clear all traces, both fetched and outstanding.
Finally, the arguments and return values for each trace entry are interactive buttons. Clicking them opens the SLIME inspector on them. Invoking M-RET M-x slime-trace-dialog-copy-down-to-repl returns them to the REPL for manipulation . The number left of each entry indicates its absolute position in the calling order, which might differ from display order in case multiple threads call the same traced function.
M-x slime-trace-dialog-hide-details-mode hides arguments and return values so you can concentrate on the calling logic. Additionally, M-x slime-trace-dialog-autofollow-mode will automatically display additional detail about an entry when the cursor moves over it.
The interactive debugger
Whenever an exceptional situation happens (see
error handling), or when you ask for it (using step or break),
the interactive debugger pops up.
It presents the error message, the available actions (restarts), and the backtrace. A few remarks:
- the restarts are programmable, we can create our own.
- in Slime, press
von a stack trace frame to view the corresponding source file location. - hit Enter (or
t) on a frame to toggle more details, - use
eto evaluate some code from within that frame, - hit
rto restart a given frame (see below). - we can explore the functionality with the menu that should appear in our editor.
Compile with maximum debugging information (declaim and C-u prefix)
Usually your compiler will optimize things out and this will reduce the amount of information available to the debugger. For example sometimes we can’t see intermediate variables of computations. We can change the optimization choices with:
(declaim (optimize (speed 0) (space 0) (debug 3)))
and recompile our code. You can achieve the same with a handy shortcut: C-u C-c C-c: the form is compiled with maximum debug settings. You can on the contrary use a negative prefix argument (M--) to compile for speed. And use a numeric argument to set the setting to it (you should read the docstring of slime-compile-defun).
Likewise, you can apply maximum debug settings to all the code of your
current buffer with C-u C-c C-k. Use the M-- prefix for maximum speed.
Step
step is an interactive command with similar scope than trace. This:
;; note: we copied factorial over to a file, to have more debug information.
(step (factorial 3))
gives an interactive pane with available actions (restarts) and the backtrace:
Evaluating call:
  (FACTORIAL 3)
With arguments:
  3
   [Condition of type SB-EXT:STEP-FORM-CONDITION]

Restarts:
 0: [STEP-CONTINUE] Resume normal execution   <-------------------- stepping actions
 1: [STEP-OUT] Resume stepping after returning from this function
 2: [STEP-NEXT] Step over call
 3: [STEP-INTO] Step into call
 4: [RETRY] Retry SLIME REPL evaluation request.
 5: [*ABORT] Return to SLIME's top level.
 --more--

Backtrace:
  0: (FACTORIAL 3)     <----------- press Enter to fold/unfold. Fix your code and press "r" to restart it.
      Locals:
        N = 3          <----------- want to check? Move the point here and
                                    press "e" to evaluate code on that frame.

  1: (SB-INT:SIMPLE-EVAL-IN-LEXENV (LET ((SB-IMPL::*STEP-OUT* :MAYBE)) (UNWIND-PROTECT (SB-IMPL::WITH-STEPPING-ENABLED #))) #S(SB-KERNEL:LEXENV :FUNS NIL :VARS NIL :BLOCKS NIL :TAGS NIL :TYPE-RESTRICTIONS ..
  2: (SB-INT:SIMPLE-EVAL-IN-LEXENV (STEP (FACTORIAL 3)) #<NULL-LEXENV>)
  3: (EVAL (STEP (FACTORIAL 3)))
 --more--
(again, be sure you compiled your function with maximum debug settings (see above). Otherwise, your compiler might do optimizations under the hood and you might not see useful information such as local variables, or you might not be able to step at all.)
You have many options here. If you are using Emacs (or any other editor actually), keep in mind that you have a “SLDB” menu that shows you the available actions, in addition to the step window.
- follow the restarts to continue stepping: continue the
execution, step out of this function, step into the function call
the point is on, step over to the next function call, or abort
everything. The shortcuts are:
c: continues: stepx: step nexto: step out
-
inspect the backtrace and the source code. You can go to the source file with
v, on each stackframe (each line of the backtrace). PressEnterort(“toggle details”) on the stackframe to see more information, such as the function parameters for this call. Usenandpto navigate, useM-nandM-pto navigate to the next or previous stackframe and to open the corresponding source file at the same time. The point will be placed on the function being called. -
evaluate code from within the context of that stackframe. In Slime, use
e(“eval in frame” anddto pretty-pint the result) and type a Lisp form. It will be executed in the context of the stackframe the point is on. Look, you can even inspect variables and have Slime open another inspector window. If you are on the first frame (0:), pressi, then “n” to inspect the intermediate variable. - resume execution from where you want. Use
rto restart the frame the point is on. For example, go change the source code (without quitting the interactive debugger), re-compile it, re-run the frame to see if it works better. You didn’t restart all the program execution, you just restarted your program from a precise point. UseRto return from a stackframe, by giving its return value.
Stepping is precious. However, if you find yourself inspecting the behaviour of a function a lot, it may be a sign that you need to simplify it and divide it in smaller pieces.
And again, LispWorks has a graphical stepper.

Resume a program execution from anywhere in the stack (demo)
In this video you will find a demo that shows the process explained above: how to fix a buggy function and how to resume the program execution from anywhere in the stack, without running everything from zero again. The video shows it with Emacs and Slime, the Lem editor, both with SBCL.
They key point is to use r (sldb-restart-frame) on a stack frame to restart it.
Break
A call to break makes the program enter the debugger, from which we can inspect the call stack, and do everything described above in the stepper.
Breakpoints in Slime
Look at the SLDB menu, it shows navigation keys and available
actions. Of which:
e(sldb-eval-in-frame) prompts for an expression and evaluates it in the selected frame. This is how we can explore our intermediate variablesdis similar with the addition of pretty printing the result
Once we are in a frame and detect a suspicious behavior, we can even
re-compile a function at runtime and resume the program execution from
where it stopped (using the “step-continue” restart
or using r (“restart frame”) on a given stackframe).
See also the Slime-star Emacs extension mentioned above to set breakpoints without code annotations.
Break when a condition occurs: *break-on-signals*
break-on-signals can be specially helpful when you see that an error (or any condition) occurred, but you didn’t get the debugger, and you want to force the debugger to open just before the error (or any condition) is signaled.
For example, you witness that a print-object method of a database
record from a third-party library tells you something wrong happened:
#<DB record: <<ERROR while printing the DB object>> >
However, the library handled the error and you didn’t get the interactive debugger.
To debug this, you can set *break-on-signals to 'error (or any symbol referring to an existing condition type).
This is the usual case: *break-on-signals* is NIL.
(ignore-errors
 (format t "*break-on-signals* value is: ~a~&" *break-on-signals*)
 (error 'simple-error :format-control "Oh no!"))
;; *break-on-signals* value is: NIL   <--- stdout
;; NIL                                <--- first returned value
;; #<SIMPLE-ERROR "Oh no!" {1205C6BC03}>  <-- second returned value, the condition object.
Let’s set *break-on-signals* to 'error:
(let ((*break-on-signals* 'error))
 (format t "*break-on-signals* value is: ~a~&" *break-on-signals*)
  (ignore-errors
   (error 'simple-error :format-control "Oh no!")))
Even though our error is surrounded by ignore-errors, we get the interactive debugger:
Oh no!
BREAK was entered because of *BREAK-ON-SIGNALS* (now rebound to NIL).
   [Condition of type SIMPLE-CONDITION]

Restarts:
 0: [CONTINUE] Return from BREAK.
 1: [RESET] Set *BREAK-ON-SIGNALS* to NIL and continue.
 2: [REASSIGN] Return from BREAK and assign a new value to *BREAK-ON-SIGNALS*.
 …

Backtrace:
 …
from the debugger, we can inspect the stack trace, go to the line signaling the condition, fix it and resume execution.
When the condition signaled is an error, we don’t enter the debugger a second time after we handled the break.
Advise and watch
advise and watch are available in some
implementations, like CCL
(advise and
watch)
and LispWorks. They do exist in
SBCL but are not exported. advise allows to modify a function without changing its
source, or to do something before or after its execution, similar
to CLOS method combination (before, after, around methods).
watch will signal a condition when a thread attempts to write to an
object being watched. It can be coupled with the display of the
watched objects in a GUI.
For a certain class of bugs (someone is changing this value, but I
don’t know who), this can be extremely helpful.
Cross-referencing
Your Lisp can tell you all the places where a function is referenced
or called, where a global variable is set, where a macro is expanded,
and so on. For example, slime-who-calls (C-c C-w C-c or the Slime > Cross-Reference menu) will show you all the places where a function is called.
slime-who-references: global variable referencesslime-who-bind: global variable bindingsslime-who-sets: global variable settersslime-who-specializes: methods specialized on a symbolslime-who-macroexpands: places where a macro is expandedslime-list-callees: lists all the functions that are called inside a given function body.slime-list-callers: lists all the functions that call a given function.
Calling such a cross-reference function opens a new buffer with the
list of results. You can navigate between references, and also
recompile all the listed functions and macros with the usual shortcuts
(C-c C-k). This is specially useful when you just changed a macro
and you want to recompile all the functions that are using this macro.
See our Emacs page for a complete list of commands and their Slime shortcuts.
SLY stepper and SLY stickers
SLY has an improved stepper and a unique feature, stickers. You mark a piece of code, you run your code, SLY captures the results for each sticker and lets you examine the program execution interactively. It allows to see what sticker was captured, or not, so we can see at a glance the code coverage of that function call.
They are a non-intrusive alternative to print and break.
Unit tests
Last but not least, automatic testing of functions in isolation might be what you’re looking for! See the testing section and a list of test frameworks and libraries.
Remote debugging
You can have your software running on a machine over the network, connect to it and debug it from home, from your development environment.
The steps involved are to start a Swank server on the remote machine (Swank is the backend companion of Slime), create an ssh tunnel and connect to the Swank server from our editor. Then we can browse and evaluate code on the running instance transparently.
To test this, let’s define a function that prints forever.
If needed, import the dependencies first:
(ql:quickload '("swank" "bordeaux-threads"))
;; a little common lisp swank demo
;; while this program is running, you can connect to it from
;; another terminal or machine
;; and change the definition of doprint to print something else out!

(require :swank)
(require :bordeaux-threads)

(defparameter *counter* 0)

(defun dostuff ()
  (format t "hello world ~a!~%" *counter*))

(defun runner ()
  (swank:create-server :port 4006 :dont-close t)
  (format t "we are past go!~%")
  (bt:make-thread (lambda ()
                    (loop repeat 5 do
                          (sleep 5)
                          (dostuff)
                          (incf *counter*)))
                  :name "do-stuff"))

(runner)
On the server, we can run this code with
sbcl --load demo.lisp
If you check with (bt:all-threads), you’ll see your Swank server running on port 4006, as well
as the other thread ready to do stuff:
(#<SB-THREAD:THREAD "do-stuff" RUNNING {10027CEDC3}>
 #<SB-THREAD:THREAD "Swank Sentinel" waiting on:
      #<WAITQUEUE  {10027D0003}>
    {10027CE8B3}>
 #<SB-THREAD:THREAD "Swank 4006" RUNNING {10027CEB63}>
 #<SB-THREAD:THREAD "main thread" RUNNING {1007C40393}>)
We do port forwarding on our development machine:
ssh -L4006:127.0.0.1:4006 username@example.com
this will securely forward port 4006 on the server at example.com to our local computer’s port 4006 (Swank only accepts connections from localhost).
We connect to the running Swank with M-x slime-connect, choosing localhost for the host
and port 4006.
We can write new code:
(defun dostuff ()
  (format t "goodbye world ~a!~%" *counter*))
(setf *counter* 0)
and eval it as usual with C-c C-c or M-x slime-eval-region for instance. The output should change.
That’s how Ron Garret debugged the Deep Space 1 spacecraft from the earth in 1999:
We were able to debug and fix a race condition that had not shown up during ground testing. (Debugging a program running on a $100M piece of hardware that is 100 million miles away is an interesting experience. Having a read-eval-print loop running on the spacecraft proved invaluable in finding and fixing the problem.
References
- “How to understand and use Common Lisp”, chap. 30, David Lamkins (book download from author’s site)
- Malisper: debugging Lisp series
- Two Wrongs: debugging Common Lisp in Slime
- Slime documentation: connecting to a remote Lisp
- cvberrycom: remotely modifying a running Lisp program using Swank
- Ron Garret: Lisping at the JPL
- the Remote Agent experiment: debugging code from 60 million miles away (youtube) (“AMA” on reddit)
Page source: debugging.md